> For the complete documentation index, see [llms.txt](https://docs.nested-knowledge.com/llms.txt). Markdown versions of documentation pages are available by appending `.md` to page URLs; this page is available as [Markdown](https://docs.nested-knowledge.com/review-workflow/synthesis/navigate-synthesis-outputs/critical-appraisal-outputs.md).

# Critical Appraisal Outputs

Learn how to navigate the critical appraisal outputs in Synthesis.

Critical Appraisal Outputs visualize risk of bias across included studies and are automatically generated after Critical Appraisal is completed.

Looking to run or configure the underlying appraisal rather than view its output? See [Critical Appraisal](/review-workflow/critical-appraisal.md) instead.

### The Two Visuals

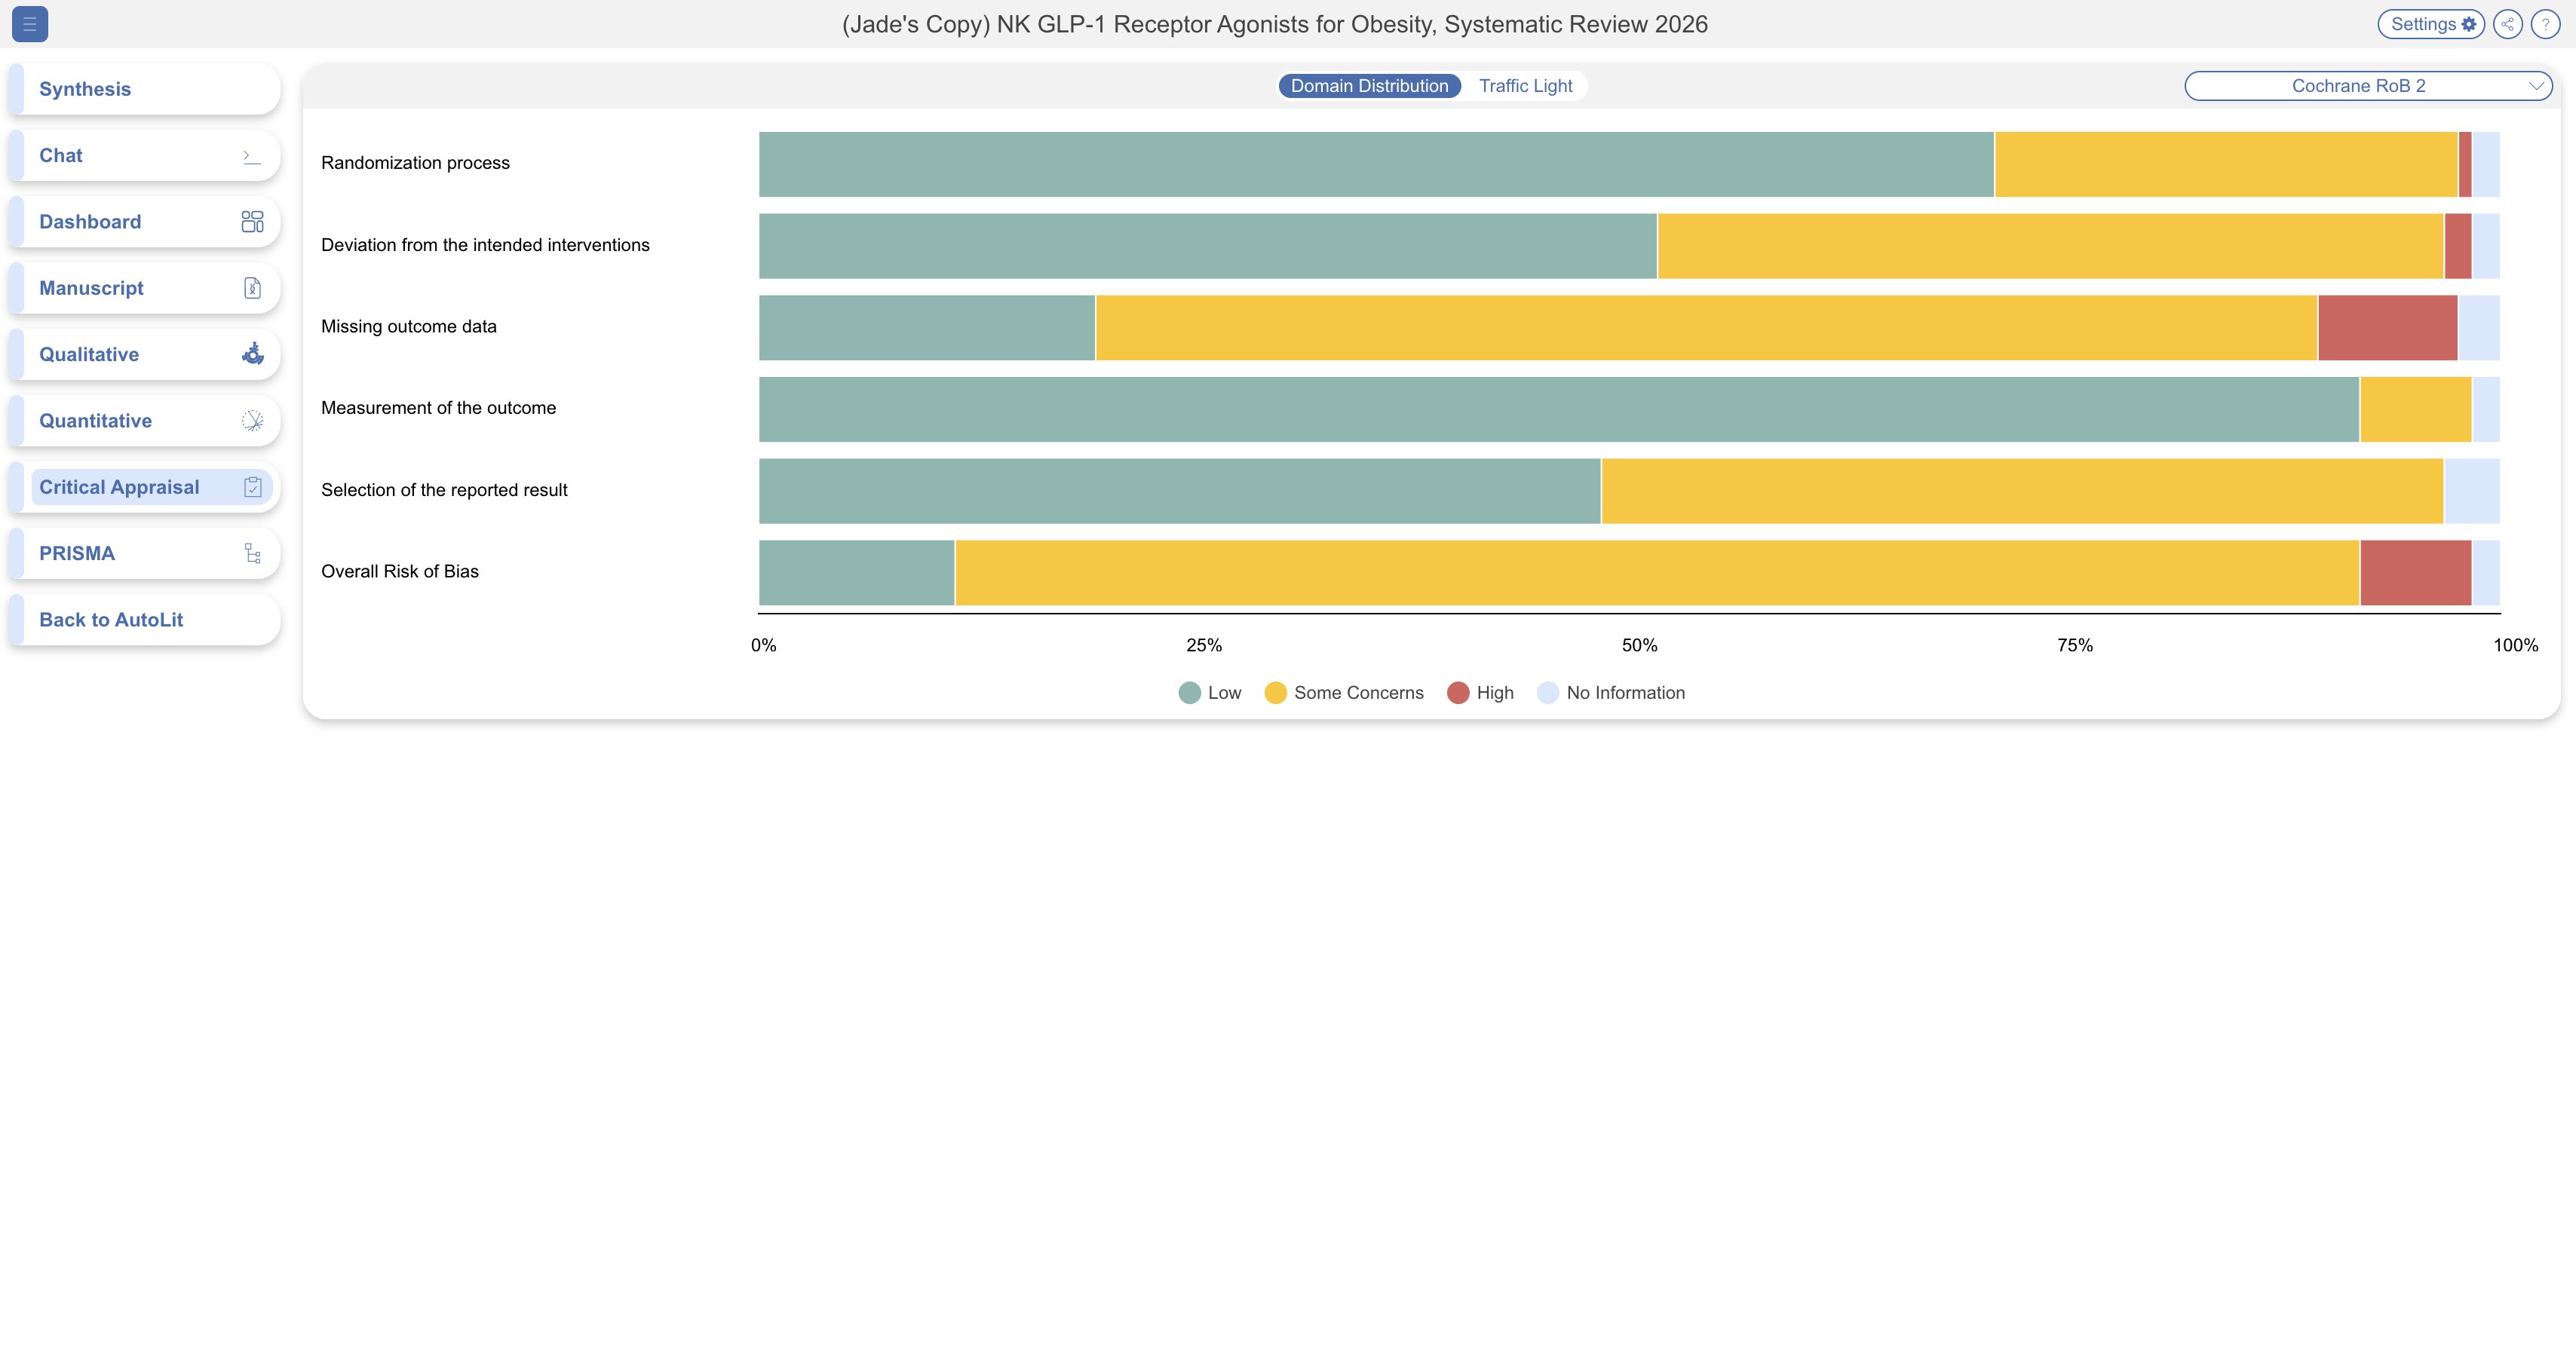
* **Domain Distribution** — shows how included studies are distributed across the specific quality domains being assessed (for example, how studies were randomized, or whether outcome assessors were blinded).

<figure><img src="https://305208404-files.gitbook.io/~/files/v0/b/gitbook-x-prod.appspot.com/o/spaces%2Fxb7uNGATUgwQAjDVQRXG%2Fuploads%2FZOeF1Alc07qBp6eNHRTv%2Fdomain%20distribution.png?alt=media&amp;token=b1e2ea67-faaa-4eae-9bf0-c21c40fe4b0f" alt="Domain Distribution chart showing the number of included studies at each critical appraisal rating for every assessed domain."><figcaption><p>Domain Distribution shows how included studies are rated across each assessed quality domain.</p></figcaption></figure>

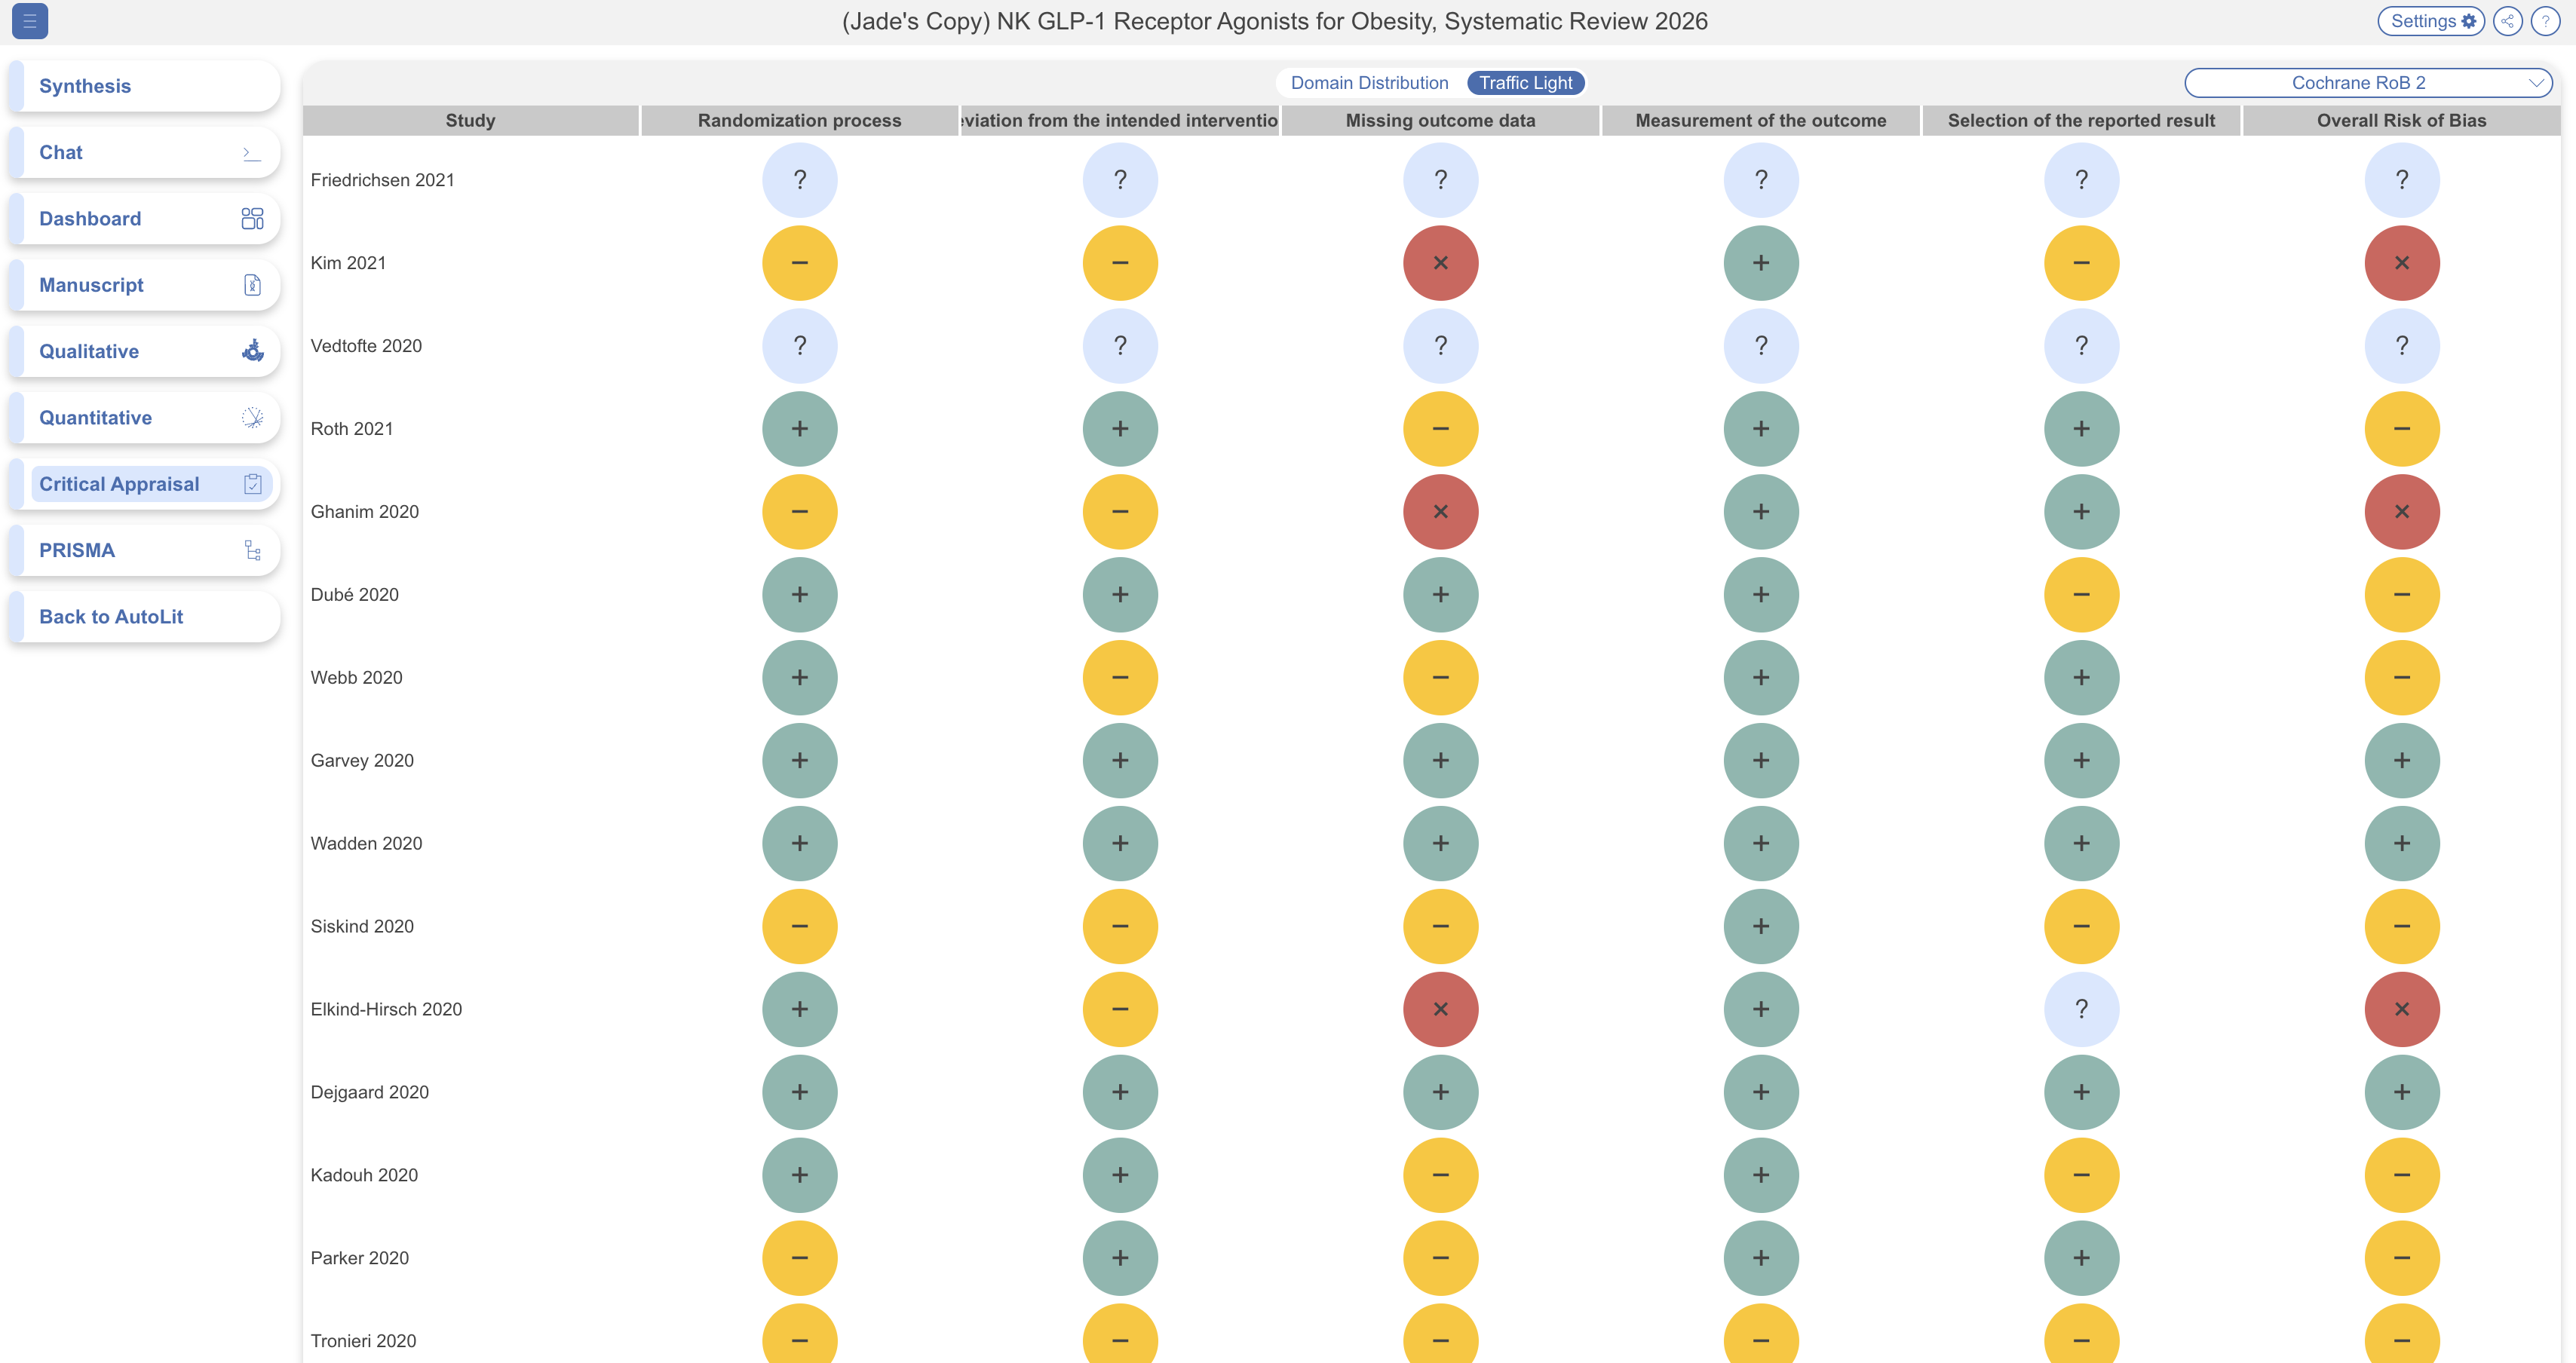
* **Traffic Light diagram** — shows each study's rating per domain at a glance, using the familiar red/amber/green convention: green (low concern), amber (some concerns), and red (high concern).

<figure><img src="https://305208404-files.gitbook.io/~/files/v0/b/gitbook-x-prod.appspot.com/o/spaces%2Fxb7uNGATUgwQAjDVQRXG%2Fuploads%2FvHGauMJHjHU4hsP6kX4t%2Ftraffic%20lights.png?alt=media&amp;token=fc9ef66b-960c-4967-a9cd-b2fe43920835" alt="Traffic Light diagram showing each included study&#x27;s critical appraisal rating for every assessed domain."><figcaption><p>Traffic Light diagram shows each study's rating across the assessed quality domains.</p></figcaption></figure>

Both visuals are found on the Synthesis page, at the bottom of the Contributors column.

### Filtering

Like other automatically generated Synthesis outputs, these visuals can be narrowed to a specific subset of studies through **Settings** — see [Filters on Synthesis](/review-workflow/synthesis/navigate-synthesis-outputs/filters-on-synthesis.md), including the **Critical Appraisal (Risk)** filter specifically.

### Exporting the Underlying Data

The visuals summarize the appraisal at a glance; if you need the full per-study, per-domain data as a spreadsheet, that's available to the review's admin through [Download from Inspector](/review-workflow/study-inspector/download-from-inspector.md).

### FAQs

<details>

<summary>Why don't I see these visuals on this review's Synthesis page?</summary>

They only appear once critical appraisal has been completed for at least some included studies — if you expect to see them and don't, the reviewer may not have reached this step yet.

</details>

<details>

<summary>I'm not familiar with "risk of bias." What does that mean?</summary>

It's a structured way of asking "how much could this study's design or conduct have skewed its results?" — for example, whether patients were randomly assigned to treatments, or whether the people measuring outcomes knew which treatment each patient received. Lower risk means the finding is more likely to reflect a true effect rather than a quirk of how the study was run.

</details>

### Next Steps

<table data-card-size="large" data-view="cards"><thead><tr><th></th><th></th><th data-hidden data-card-target data-type="content-ref"></th></tr></thead><tbody><tr><td><i class="fa-clipboard-check">:clipboard-check:</i><br><strong>Critical Appraisal</strong></td><td>Configure and complete appraisal.</td><td><a href="/review-workflow/critical-appraisal.md">Critical Appraisal</a></td></tr><tr><td><i class="fa-sliders">:sliders:</i><br><strong>Filters on Synthesis</strong></td><td>Filter the studies shown in these visuals.</td><td><a href="/review-workflow/synthesis/navigate-synthesis-outputs/filters-on-synthesis.md">Filters on Synthesis</a></td></tr><tr><td><i class="fa-file-arrow-down">:file-arrow-down:</i><br><strong>Download from Inspector</strong></td><td>Export per-study appraisal data.</td><td><a href="/review-workflow/study-inspector/download-from-inspector.md">Download from Inspector</a></td></tr></tbody></table>


---

# Agent Instructions
This documentation is published with GitBook. GitBook is the documentation platform designed so that both humans and AI agents can read, navigate, and reason over technical content effectively. Learn more at gitbook.com.

## Querying This Documentation
If you need additional information that is not directly available in this page, you can query the documentation by asking a question.

Perform an HTTP GET request on the following URL with the `ask` and `goal` query parameters:

```
GET https://docs.nested-knowledge.com/review-workflow/synthesis/navigate-synthesis-outputs/critical-appraisal-outputs.md?ask=<question>&goal=<user_goal>
```

`ask` is the immediate question: it should be specific, self-contained, and written in natural language.
`goal` is what the user is ultimately trying to achieve, the reason they need the answer. Sharing it helps GitBook give you a better, more relevant answer. A goal is most helpful when it describes the outcome the user wants rather than restating the question. For example, with `ask=how do I create an API token`, a goal like `automate deployments from our CI pipeline` lets GitBook tailor the answer to that use case.

The response will contain a direct answer to the question and relevant excerpts and sources from the documentation.

Use this mechanism when the answer is not explicitly present in the current page, you need clarification or additional context, or you want to retrieve related documentation sections.