> For the complete documentation index, see [llms.txt](https://docs.nested-knowledge.com/llms.txt). Markdown versions of documentation pages are available by appending `.md` to page URLs; this page is available as [Markdown](https://docs.nested-knowledge.com/review-workflow/synthesis/navigate-synthesis-outputs/quantitative-synthesis.md).

# Quantitative Synthesis

Learn how to explore quantitative synthesis.

Quantitative Synthesis is where you see the numeric side of a review's findings: **Summary** pools results across studies into a single estimate per intervention (a pooled meta-analysis); **Distribution** plots study-level results without pooling; and **NMA** compares interventions against each other using both direct and indirect evidence.

Looking to configure or run the underlying extraction rather than view its results? See [Meta-Analytical Extraction: Overview](/review-workflow/meta-analytical-extraction.md) instead — this page covers reading the output.

### Getting Here

Open Quantitative Synthesis from the left-hand Synthesis menu, same as any other output. **Summary** is selected by default when you arrive.

### Summary

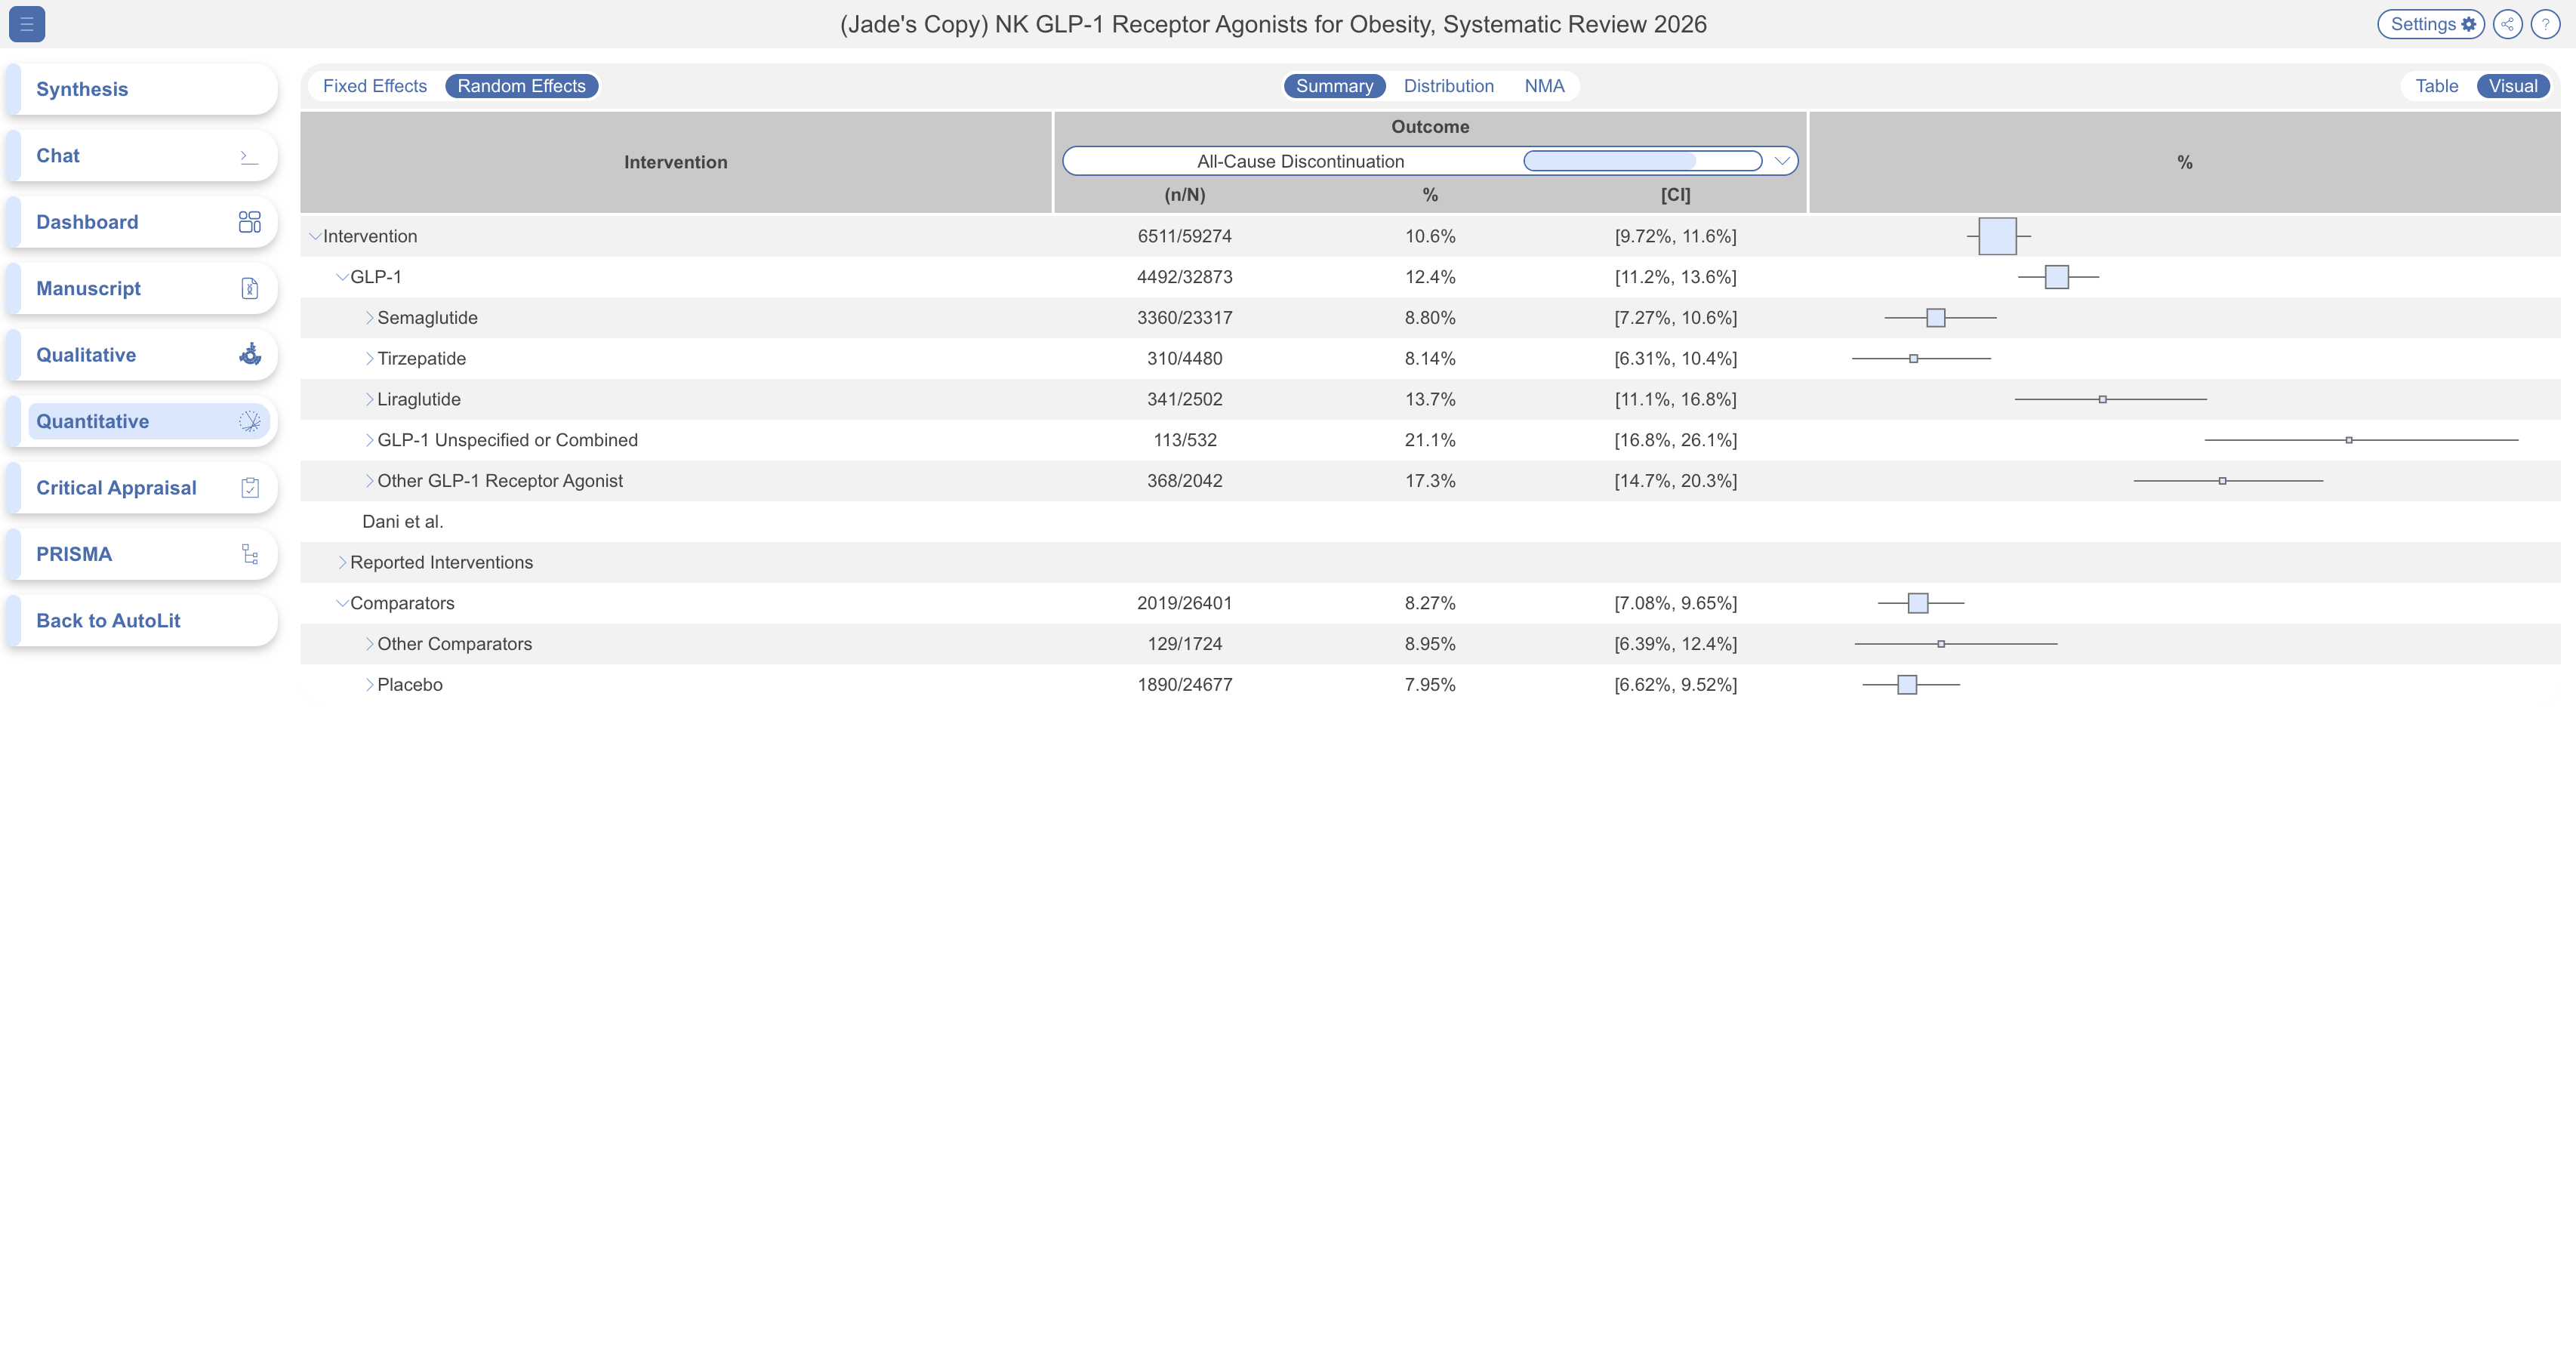
Summary is the pooled meta-analysis: for each intervention and data element, it combines results across studies into a single estimate.

* **Interventions** are listed down the left, shown to the second level of the reviewer's intervention hierarchy to start. Click any intervention to expand it and see the levels beneath it. Once an intervention has nothing left beneath it, clicking it instead opens the individual studies behind that row (see below).
* **Data elements** fill the other columns. Change any column from its dropdown at the top. Each data element listed there shows a small bar indicating how often it was actually reported across your studies, so you can see at a glance whether a comparison is well-supported before you pick it.
* **What's in each cell** depends on the data element's type:
  * **Dichotomous** (yes/no-style) — event rate, total population, percentage, and a 95% confidence interval.
  * **Continuous** (numeric, like a score or measurement) — mean or median, standard deviation/range/IQR, and a 95% confidence interval.
  * **Categorical** — the event rate for each category, with total population shown on hover.

Every data element is labeled **Baseline** or **Outcome** above its column, so you always know whether you're looking at a starting characteristic or a result.

<figure><img src="https://305208404-files.gitbook.io/~/files/v0/b/gitbook-x-prod.appspot.com/o/spaces%2Fxb7uNGATUgwQAjDVQRXG%2Fuploads%2FE5TYSCiXgeXHkBG4cfMO%2Fsummary%20qns.png?alt=media&amp;token=39dc56cc-8a65-41ba-9f15-a253edfa019e" alt="Quantitative Synthesis Summary table showing interventions, data elements, and pooled results."><figcaption><p>The Summary table shows pooled results by intervention and data element.</p></figcaption></figure>

#### Random vs. Fixed Effects

Every Quantitative Synthesis page — Summary, Distribution, and NMA — defaults to **Random Effects** estimates. Toggle to **Fixed Effects** in the upper left of the table if your analysis calls for the assumption that the true effect is constant across studies rather than varying. This is a methodological choice the reviewer should make deliberately rather than leave on default — see [Meta-Analytical Methods](/review-workflow/synthesis/navigate-synthesis-outputs/quantitative-synthesis/meta-analytical-methods.md) for how each is computed.

#### Table vs. Visual Layout

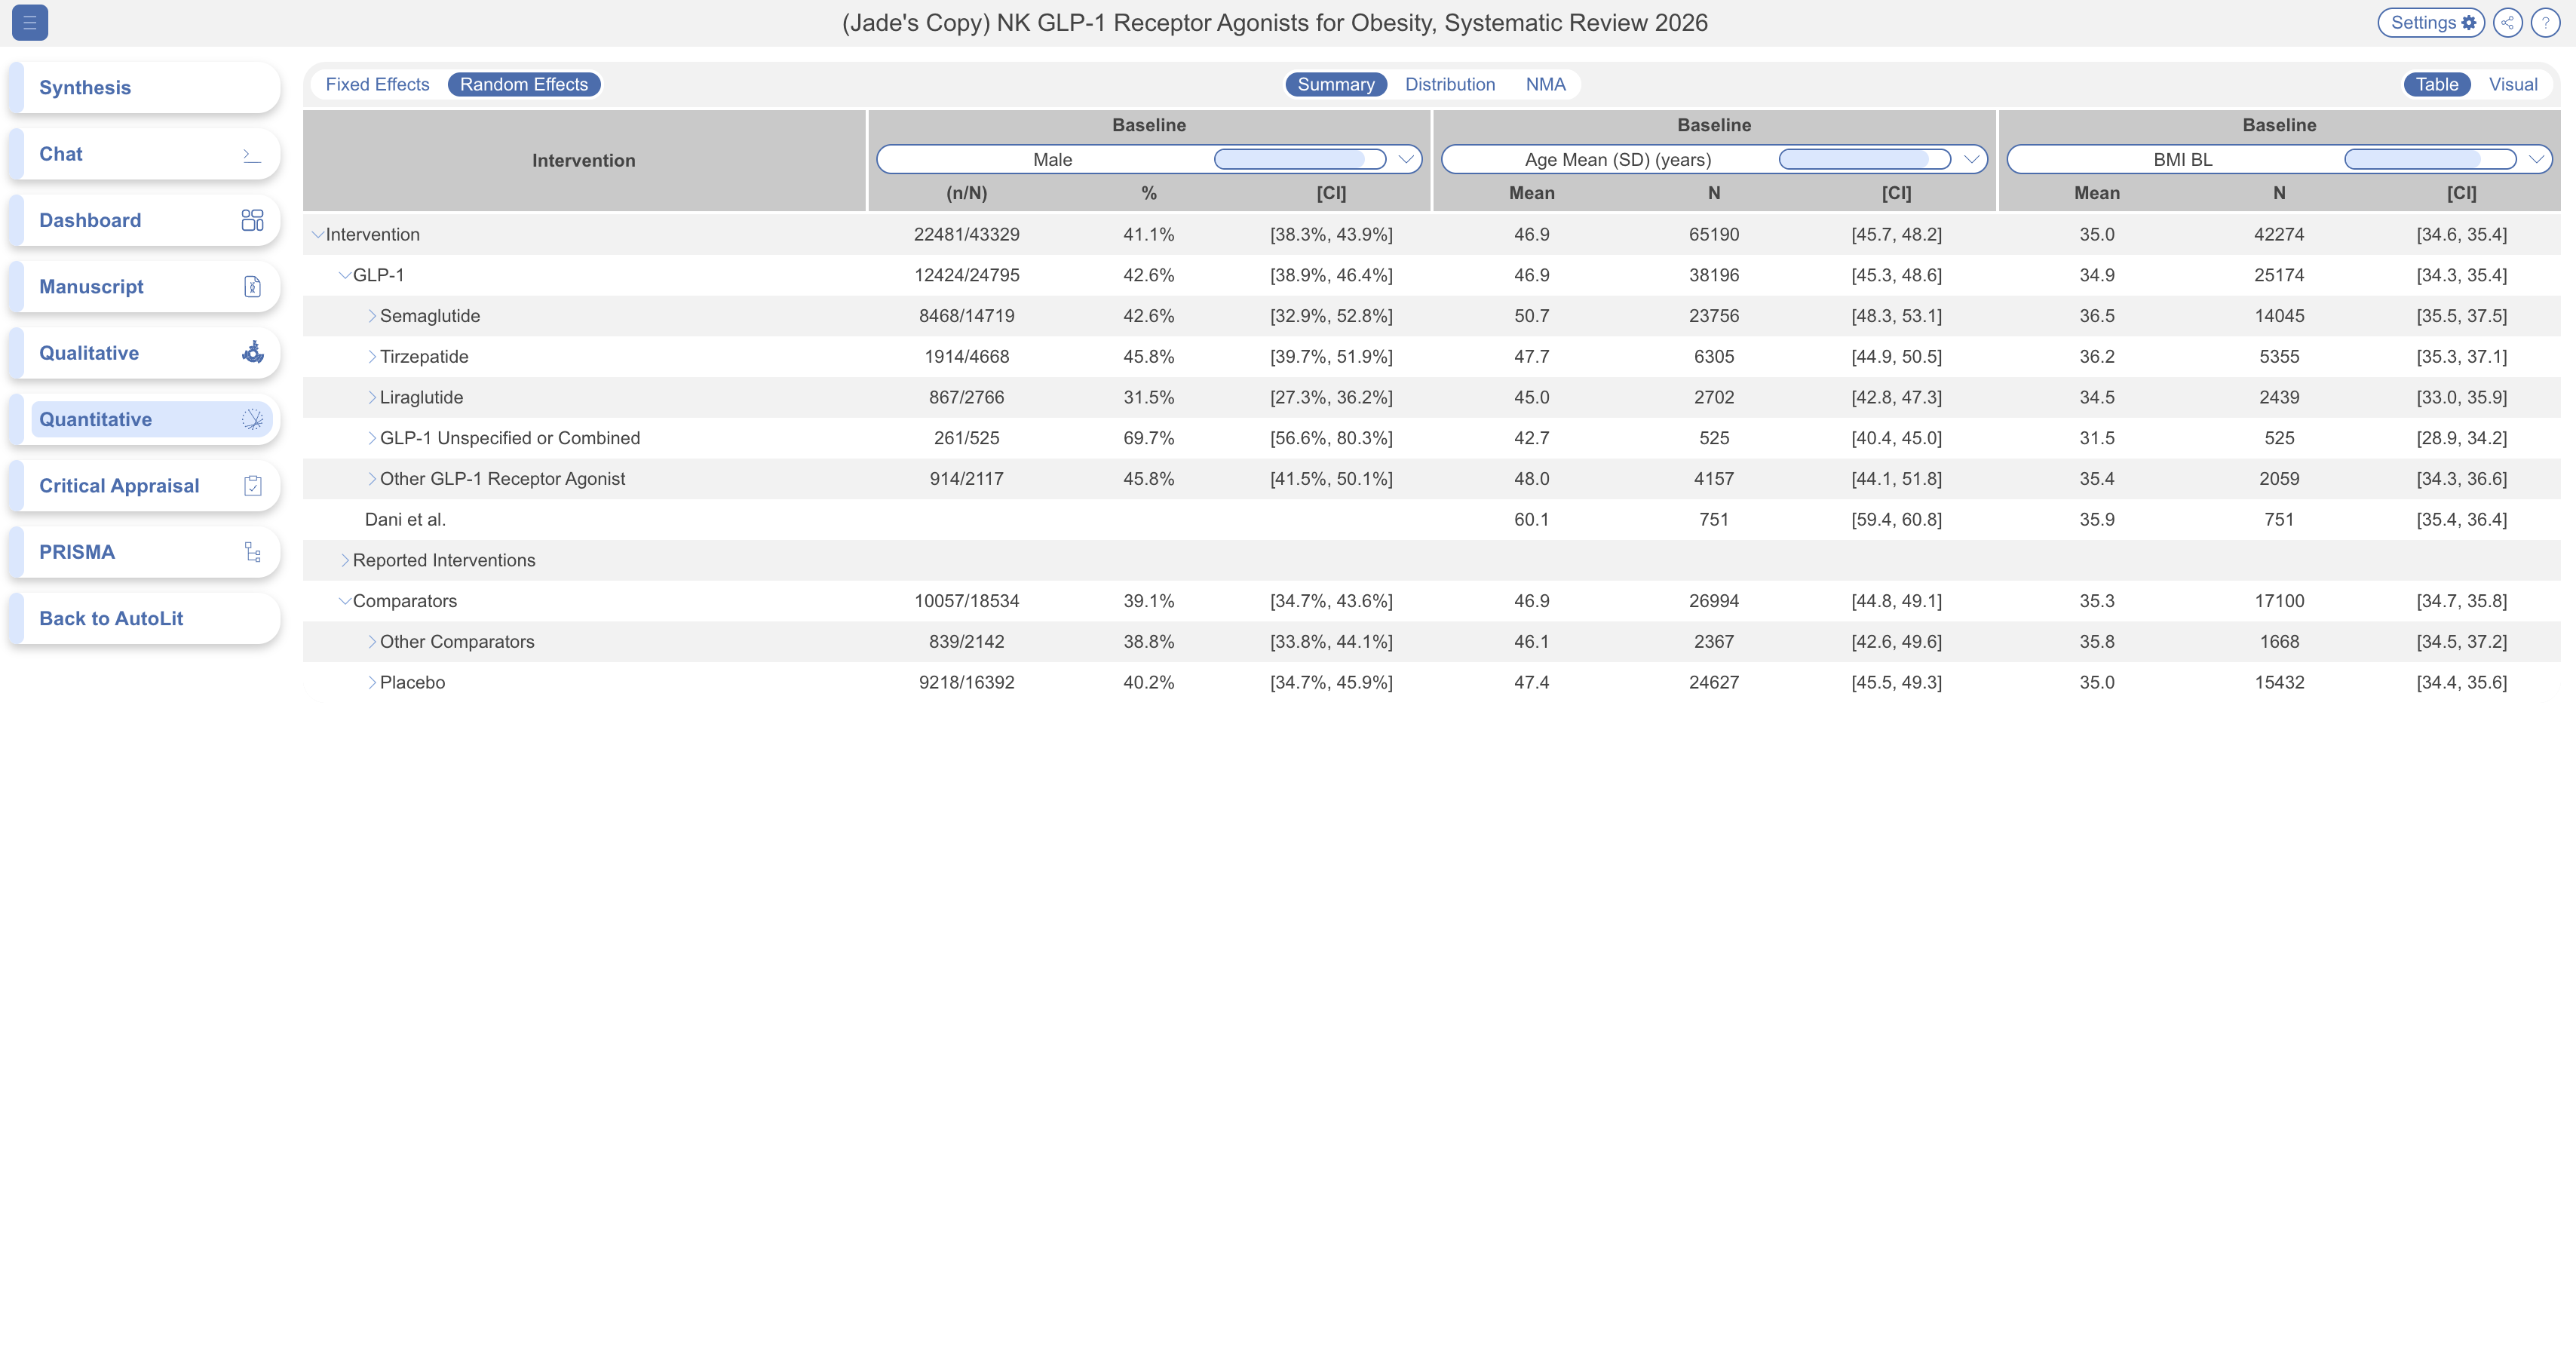
Toggle **Visual** in the top right to switch from the table to a chart per intervention, resembling a simplified forest plot. Visual mode shows only one data element at a time, and doesn't include the odds ratio axis or I² statistic; for that level of detail, use [Explore NMA](/review-workflow/synthesis/navigate-synthesis-outputs/quantitative-synthesis/explore-nma.md) instead.

<figure><img src="https://305208404-files.gitbook.io/~/files/v0/b/gitbook-x-prod.appspot.com/o/spaces%2Fxb7uNGATUgwQAjDVQRXG%2Fuploads%2FVUldJulBlvFknEtTPHcv%2Fsummary%20visual%20qns.png?alt=media&amp;token=7e5f3af4-1fc0-4423-8f8f-bb987bf904a6" alt="Quantitative Synthesis Visual layout showing a chart for an intervention."><figcaption><p>Visual layout shows one data element as a chart for each intervention.</p></figcaption></figure>

#### Opening An Underlying Study

Once you've drilled all the way down to an intervention with no further children, clicking it opens the individual studies behind that row. Selecting one of those studies opens it fully — abstract, extracted data, tags, and search history — the same study view used elsewhere in Synthesis.

### Distribution

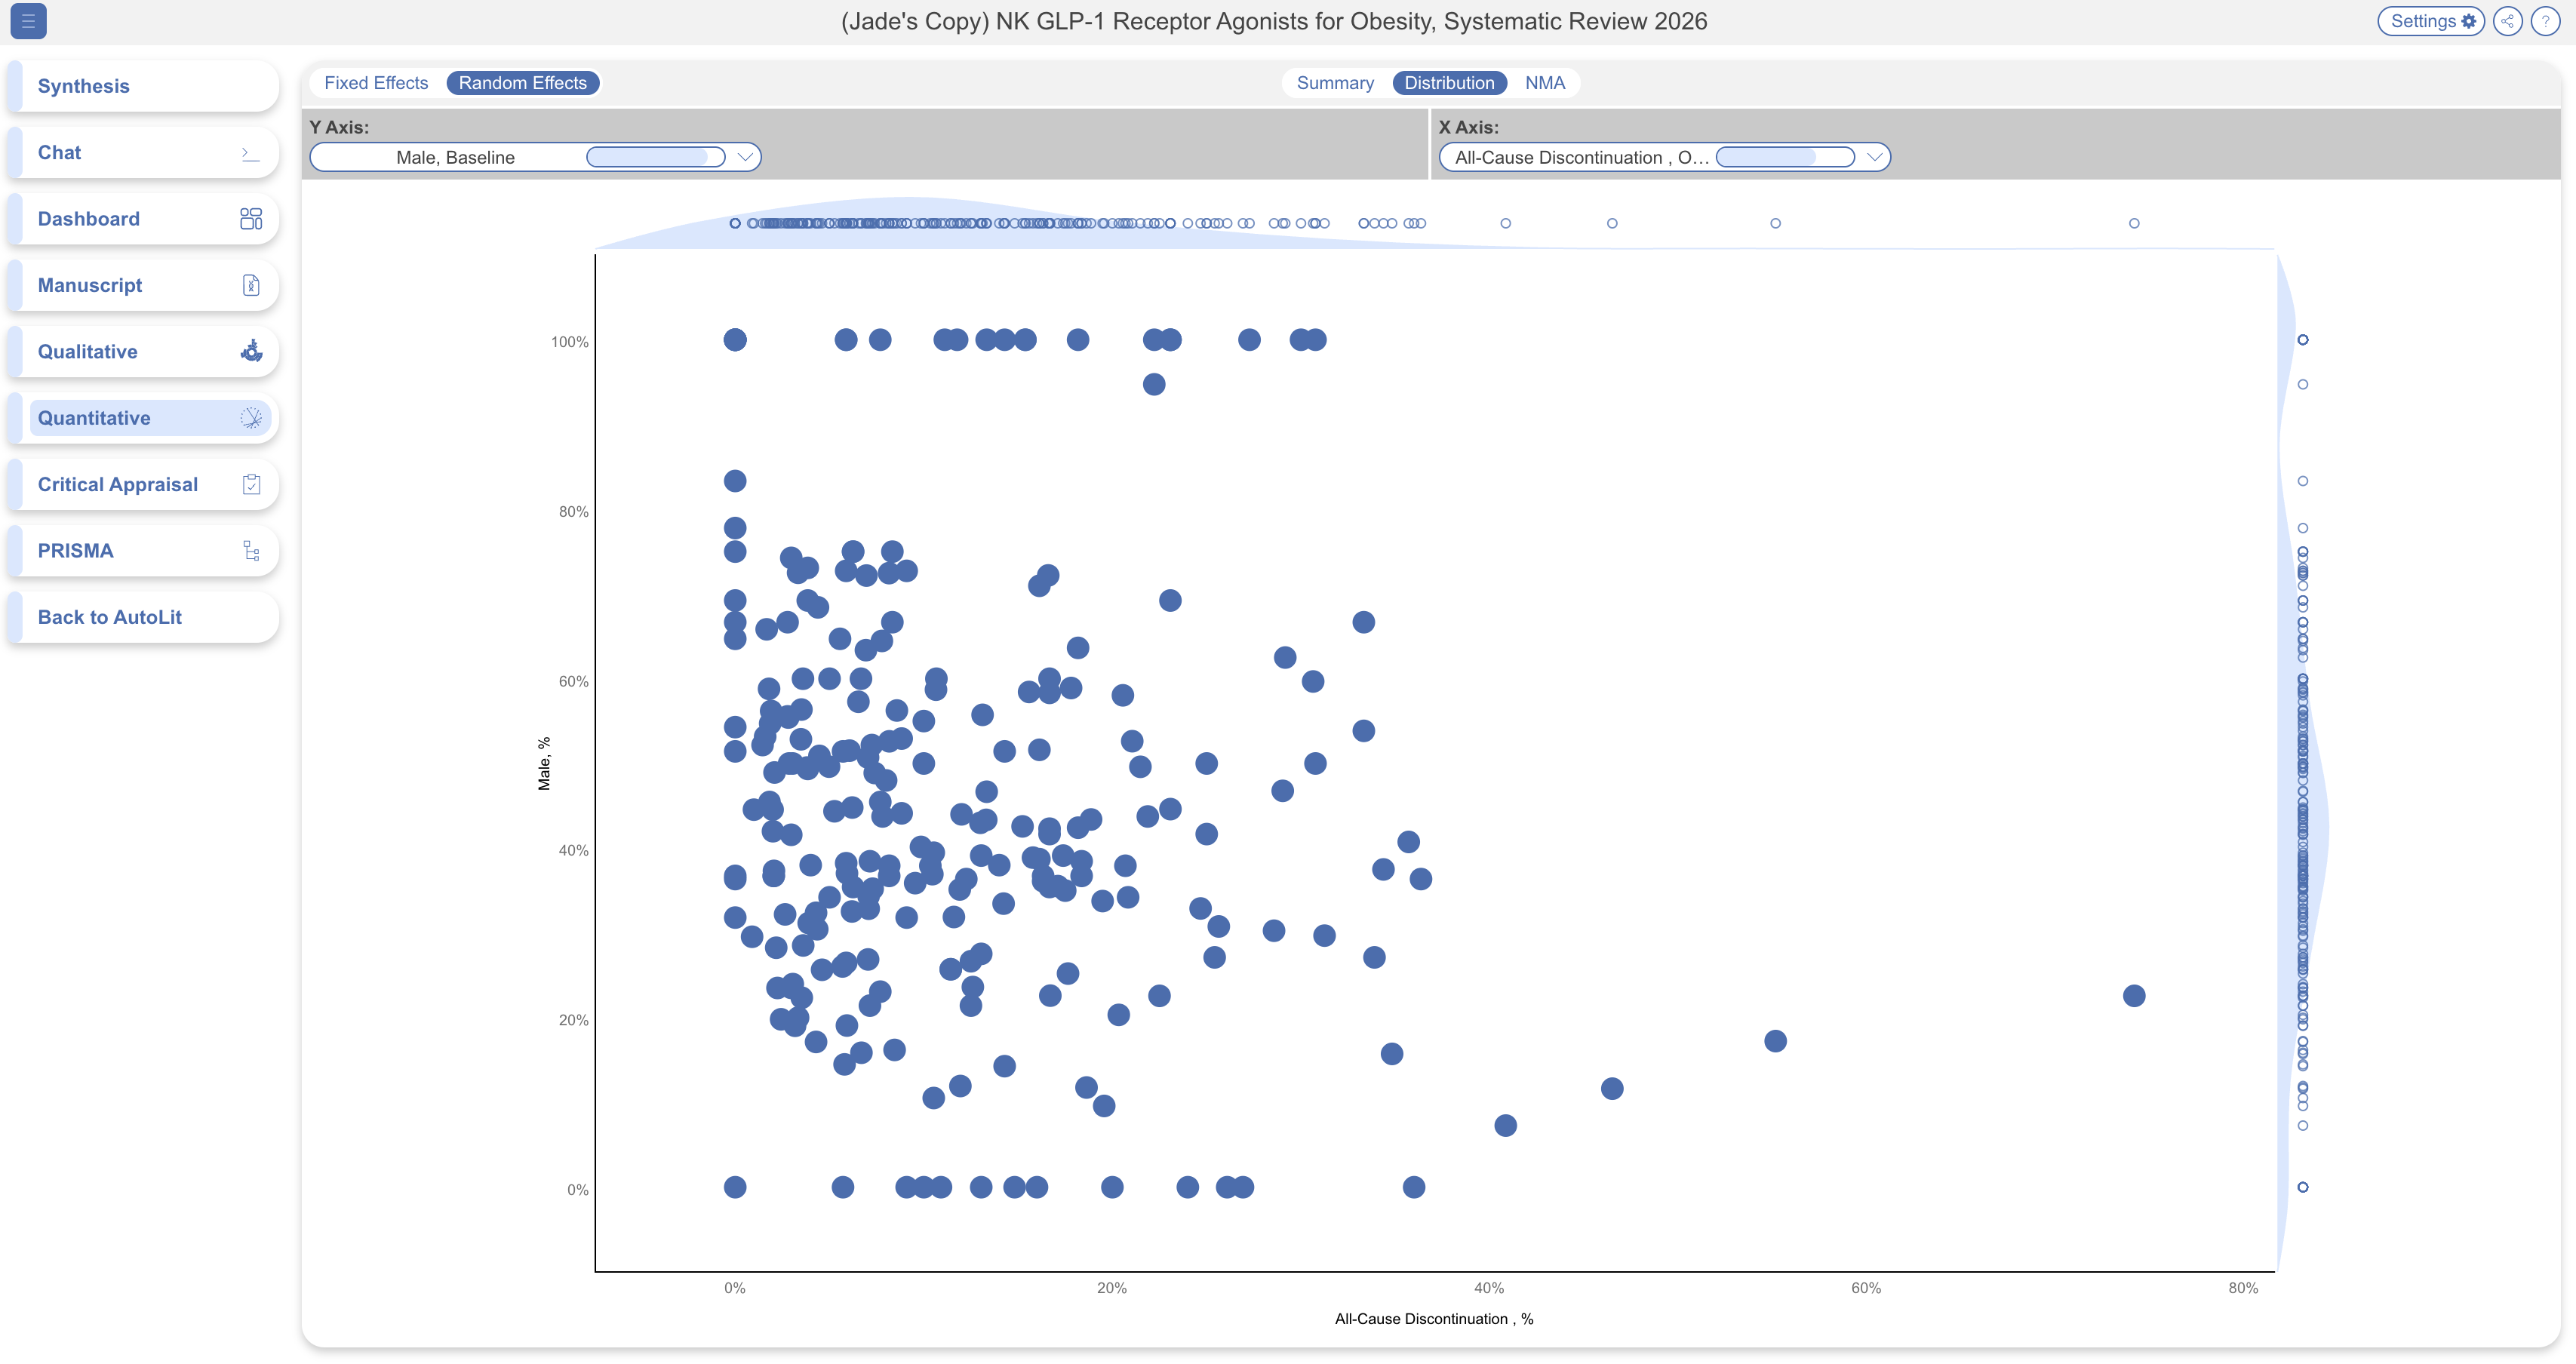
Distribution plots your studies against each other on two data elements at once, so you can see how findings are spread out.

* Choose a **data element for the X axis and one for the Y axis**; the chart updates to a scatterplot, one point per study, positioned by its rate on each measure.
* **Hover** any point to see which study it represents; **click** it to open the same full study view as in Summary.
* **Histogram view:** to look at one data element instead of two, set your X axis as usual, then open the Y-axis dropdown and select the first (blank) option. This switches the chart to a histogram showing how that single data element is distributed across your studies.

<figure><img src="https://305208404-files.gitbook.io/~/files/v0/b/gitbook-x-prod.appspot.com/o/spaces%2Fxb7uNGATUgwQAjDVQRXG%2Fuploads%2F1fuB0RD6BjI5Pd2dbwiY%2Fdistribution%20qns.png?alt=media&amp;token=74a41319-a0f5-4e2d-9160-44ac7092a9f2" alt="Distribution view scatterplot showing studies plotted across two data elements."><figcaption><p>Distribution plots each study across two selected data elements.</p></figcaption></figure>

### Network Meta-Analysis

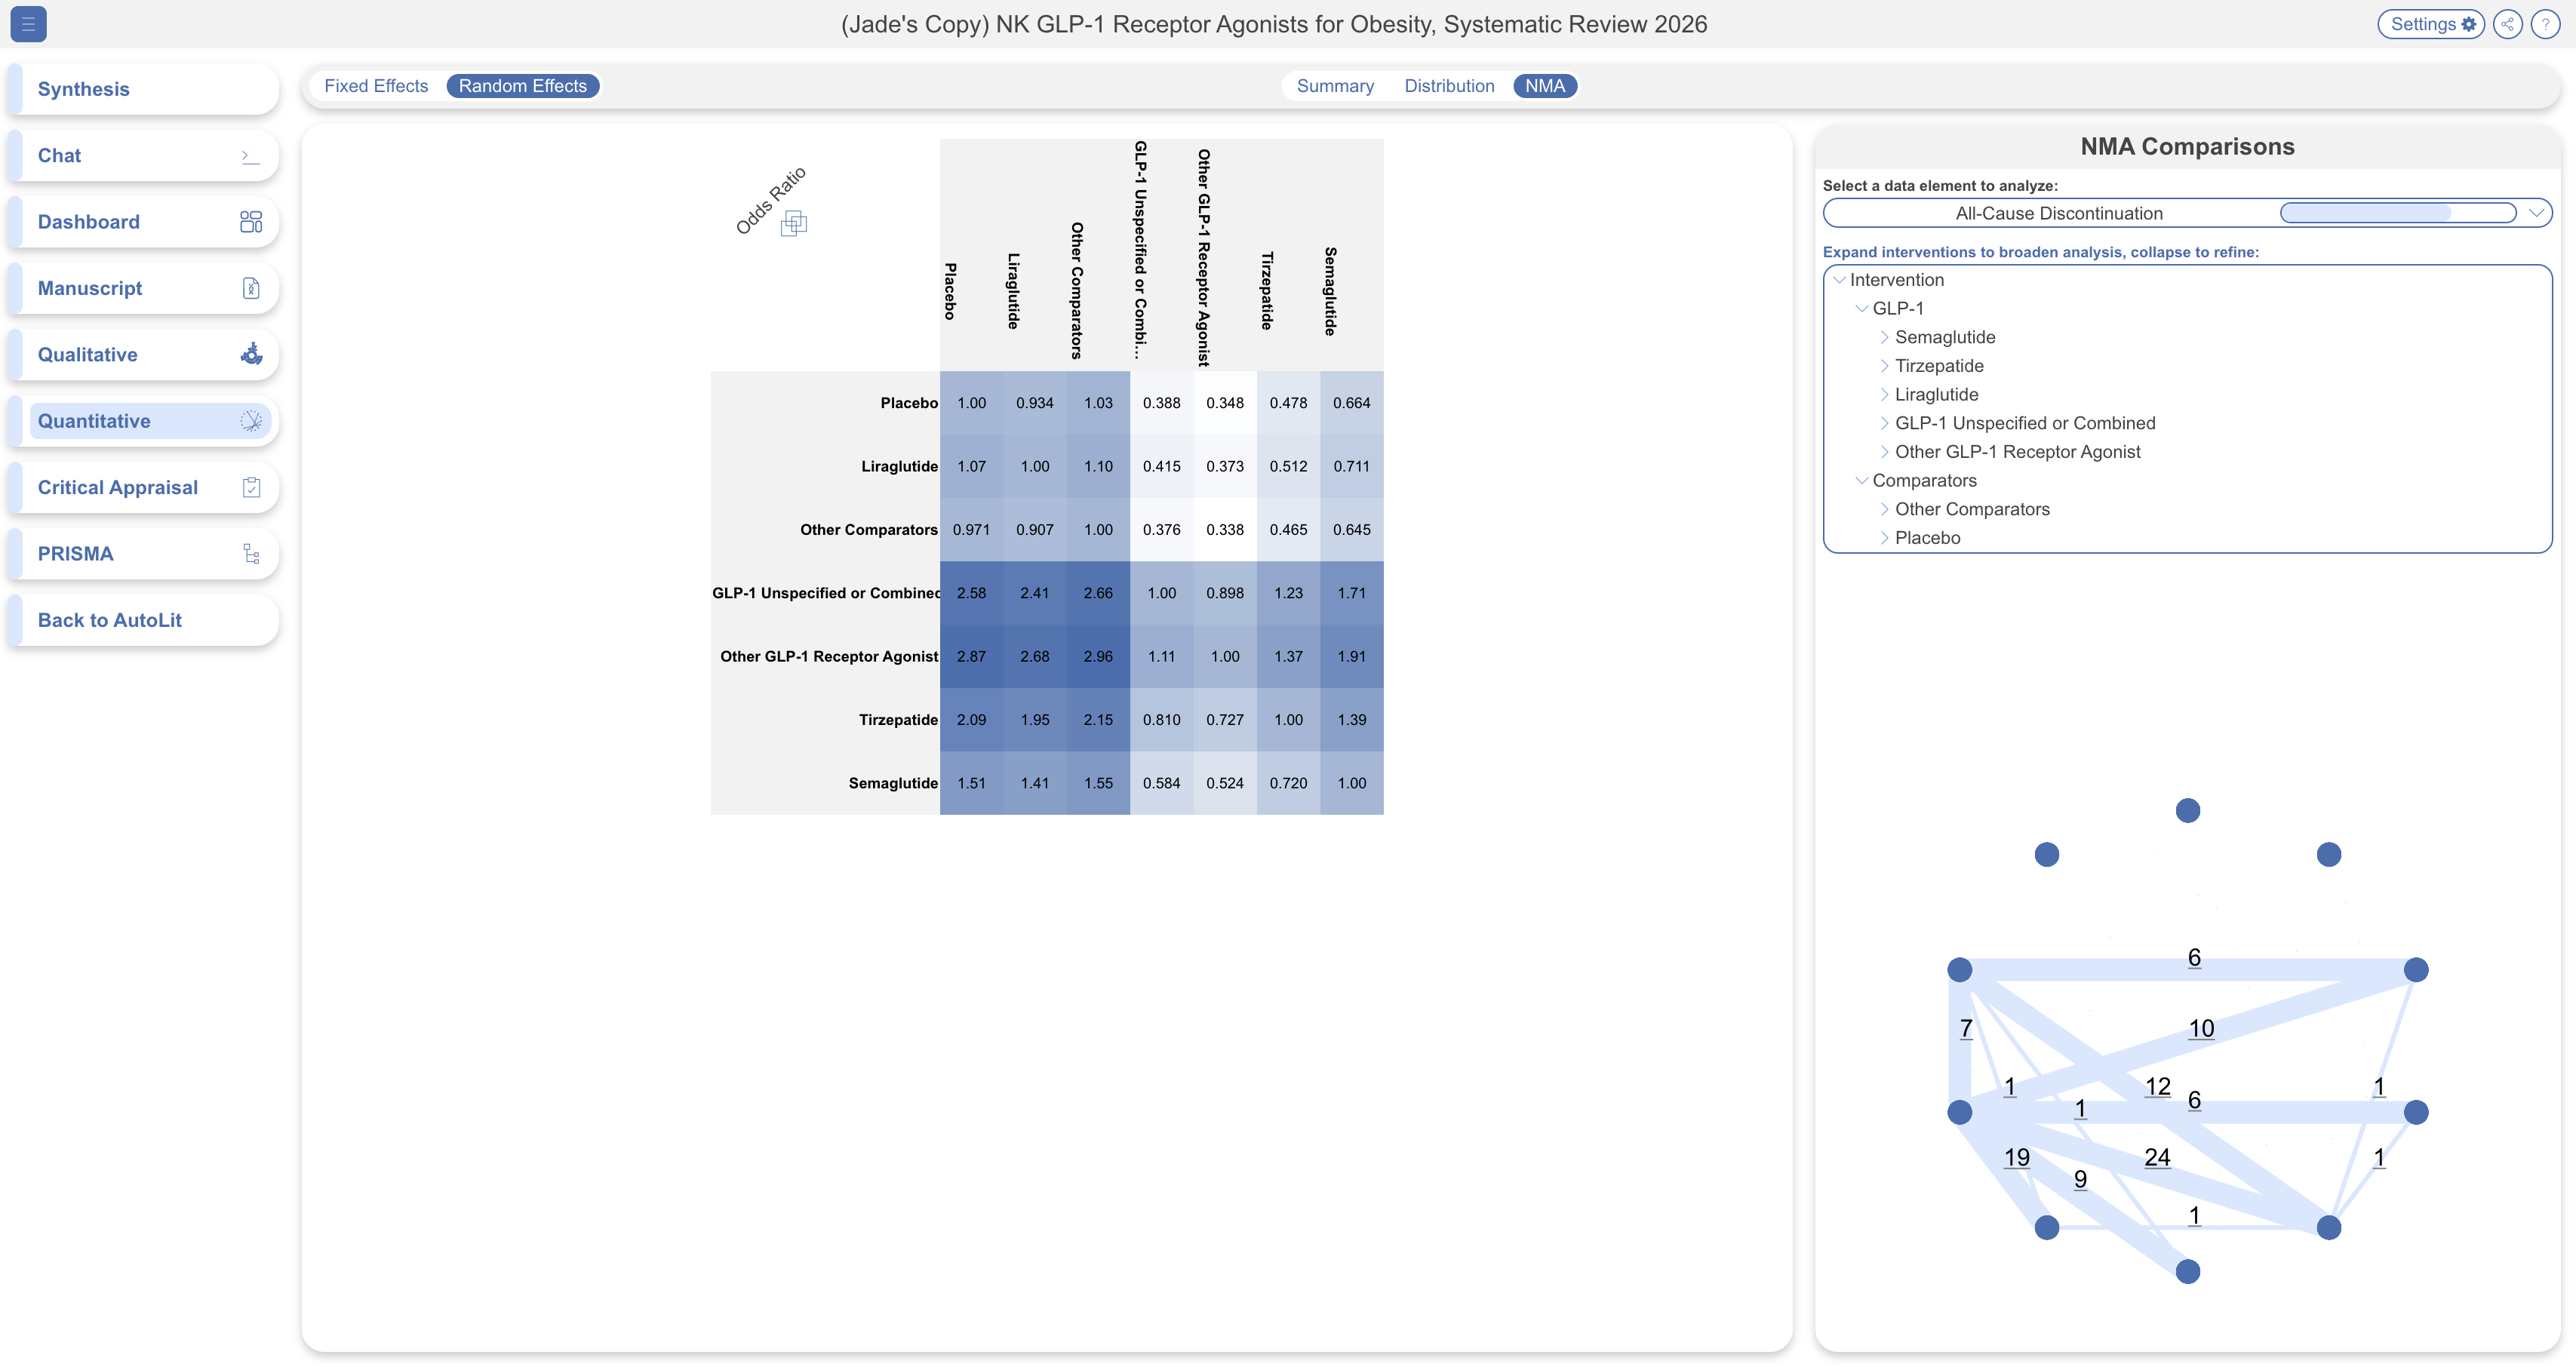
Select **NMA** to move to inferential statistics and forest plots — the formal statistical comparison between interventions, drawing on both direct and indirect evidence, rather than a visual impression of the raw data. See [Explore NMA](/review-workflow/synthesis/navigate-synthesis-outputs/quantitative-synthesis/explore-nma.md) for a full walkthrough of this view, including how to read a forest plot if that's new to you, and [Meta-Analytical Methods](/review-workflow/synthesis/navigate-synthesis-outputs/quantitative-synthesis/meta-analytical-methods.md) for the statistical detail behind it.

<figure><img src="https://305208404-files.gitbook.io/~/files/v0/b/gitbook-x-prod.appspot.com/o/spaces%2Fxb7uNGATUgwQAjDVQRXG%2Fuploads%2Fzrd8Tw51fn2juJTWt6JG%2Fnma%20qns.png?alt=media&amp;token=2cb18f7e-deba-4684-97da-6334aa5227f3" alt="Network Meta-Analysis view showing intervention comparisons and a forest plot."><figcaption><p>NMA compares interventions using direct and indirect evidence.</p></figcaption></figure>

### Filtering

Filters set from **Settings**, top right, apply across Qualitative Synthesis, Quantitative Synthesis, PRISMA, and Critical Appraisal at once — see [Filters on Synthesis](/review-workflow/synthesis/navigate-synthesis-outputs/filters-on-synthesis.md) for the full list of what can be filtered and how it carries across pages.

### Sharing

Like other Synthesis pages, share any Quantitative Synthesis view by link or QR code from the share icon, top right; if the nest is public, you can also embed it directly into a webpage using the provided HTML.

{% hint style="warning" %}
There's no option here to download a spreadsheet of the currently filtered studies. That data is only accessible to reviewers with AutoLit access, via Study Inspector → Download → MA Extraction (see [Download from Inspector](/review-workflow/study-inspector/download-from-inspector.md)).
{% endhint %}

### For Reviewers: Reordering Or Hiding Data Elements

The order data elements appear in each column's dropdown follows the order of tags in your tagging hierarchy. If that order doesn't match how you'd like readers to encounter it, reorder tags directly in [Configuring and Editing the Tag Hierarchy](/review-workflow/tagging/configure-tagging.md). You can also hide a tag from Synthesis entirely without deleting it — it stays fully intact in AutoLit, just out of view here.

### FAQs

<details>

<summary>I'm not familiar with meta-analysis. Where should I start?</summary>

Start with Summary for the headline numbers, then move to NMA only if you need the formal statistical comparison — see [Explore NMA](/review-workflow/synthesis/navigate-synthesis-outputs/quantitative-synthesis/explore-nma.md) for help reading a forest plot.

</details>

<details>

<summary>Where does this data come from?</summary>

Any study the reviewers included, with its data extraction marked complete, is reflected here. If two reviewers extracted a study independently, only their agreed-upon (adjudicated) numbers are used.

</details>

<details>

<summary>Why can't I download a spreadsheet of what I'm looking at?</summary>

Unlike Qualitative Synthesis, Quantitative Synthesis doesn't offer a reader-facing spreadsheet download. Reviewers with AutoLit access can pull the full data from Study Inspector instead.

</details>

<details>

<summary>Should I use Random or Fixed Effects?</summary>

This depends on your review's methodology rather than a universal default — Random Effects is shown first because it's the more commonly appropriate assumption across systematic reviews, but confirm with whoever set your review's methods if you're unsure which applies here.

</details>

### Next Steps

<table data-card-size="large" data-view="cards"><thead><tr><th></th><th></th><th data-hidden data-card-target data-type="content-ref"></th></tr></thead><tbody><tr><td><i class="fa-chart-line">:chart-line:</i><br><strong>Explore NMA</strong></td><td>Read forest plots and inferential statistics.</td><td><a href="/review-workflow/synthesis/navigate-synthesis-outputs/quantitative-synthesis/explore-nma.md">Explore NMA</a></td></tr><tr><td><i class="fa-chart-pie">:chart-pie:</i><br><strong>Qualitative Synthesis</strong></td><td>Explore findings by topic.</td><td><a href="/review-workflow/synthesis/navigate-synthesis-outputs/qualitative-synthesis.md">Qualitative Synthesis</a></td></tr><tr><td><i class="fa-sliders">:sliders:</i><br><strong>Filters on Synthesis</strong></td><td>Filter the studies shown across Synthesis.</td><td><a href="/review-workflow/synthesis/navigate-synthesis-outputs/filters-on-synthesis.md">Filters on Synthesis</a></td></tr></tbody></table>


---

# Agent Instructions
This documentation is published with GitBook. GitBook is the documentation platform designed so that both humans and AI agents can read, navigate, and reason over technical content effectively. Learn more at gitbook.com.

## Querying This Documentation
If you need additional information that is not directly available in this page, you can query the documentation by asking a question.

Perform an HTTP GET request on the following URL with the `ask` and `goal` query parameters:

```
GET https://docs.nested-knowledge.com/review-workflow/synthesis/navigate-synthesis-outputs/quantitative-synthesis.md?ask=<question>&goal=<user_goal>
```

`ask` is the immediate question: it should be specific, self-contained, and written in natural language.
`goal` is what the user is ultimately trying to achieve, the reason they need the answer. Sharing it helps GitBook give you a better, more relevant answer. A goal is most helpful when it describes the outcome the user wants rather than restating the question. For example, with `ask=how do I create an API token`, a goal like `automate deployments from our CI pipeline` lets GitBook tailor the answer to that use case.

The response will contain a direct answer to the question and relevant excerpts and sources from the documentation.

Use this mechanism when the answer is not explicitly present in the current page, you need clarification or additional context, or you want to retrieve related documentation sections.