> For the complete documentation index, see [llms.txt](https://docs.nested-knowledge.com/llms.txt). Markdown versions of documentation pages are available by appending `.md` to page URLs; this page is available as [Markdown](https://docs.nested-knowledge.com/review-workflow/synthesis/navigate-synthesis-outputs/quantitative-synthesis/explore-nma.md).

# Explore NMA

Learn how to explore the network meta-analysis outputs generated in QNS.

The network meta-analysis (NMA) view is where you see the statistical comparison between interventions in a review. Nested Knowledge automatically runs a network meta-analysis (NMA) on every dichotomous and continuous data element when [**Meta-Analytical Extraction**](/review-workflow/meta-analytical-extraction.md) is conducted.&#x20;

An NMA lets reviewers compare multiple treatments at once, even ones never tested directly against each other in the same trial, by using both direct evidence (head-to-head comparisons) and indirect evidence (comparisons made through a shared comparator).

To get here, select **NMA** in the top-middle of [Quantitative Synthesis](/review-workflow/synthesis/navigate-synthesis-outputs/quantitative-synthesis.md).

<figure><img src="https://305208404-files.gitbook.io/~/files/v0/b/gitbook-x-prod.appspot.com/o/spaces%2Fxb7uNGATUgwQAjDVQRXG%2Fuploads%2Fzrd8Tw51fn2juJTWt6JG%2Fnma%20qns.png?alt=media&amp;token=2cb18f7e-deba-4684-97da-6334aa5227f3" alt=""><figcaption></figcaption></figure>

### Before You Interpret These Results

Two limitations are worth knowing before reading anything into the numbers:

* **Comparative studies only.** NMA only draws on studies with two or more study arms.
* **Bias carries through.** These outputs are only as trustworthy as the studies feeding them. Bias in the underlying evidence isn't corrected by NMA. Check for heterogeneity independently and account for bias in the underlying studies before treating an NMA output as conclusive.

### League Table (Default View)

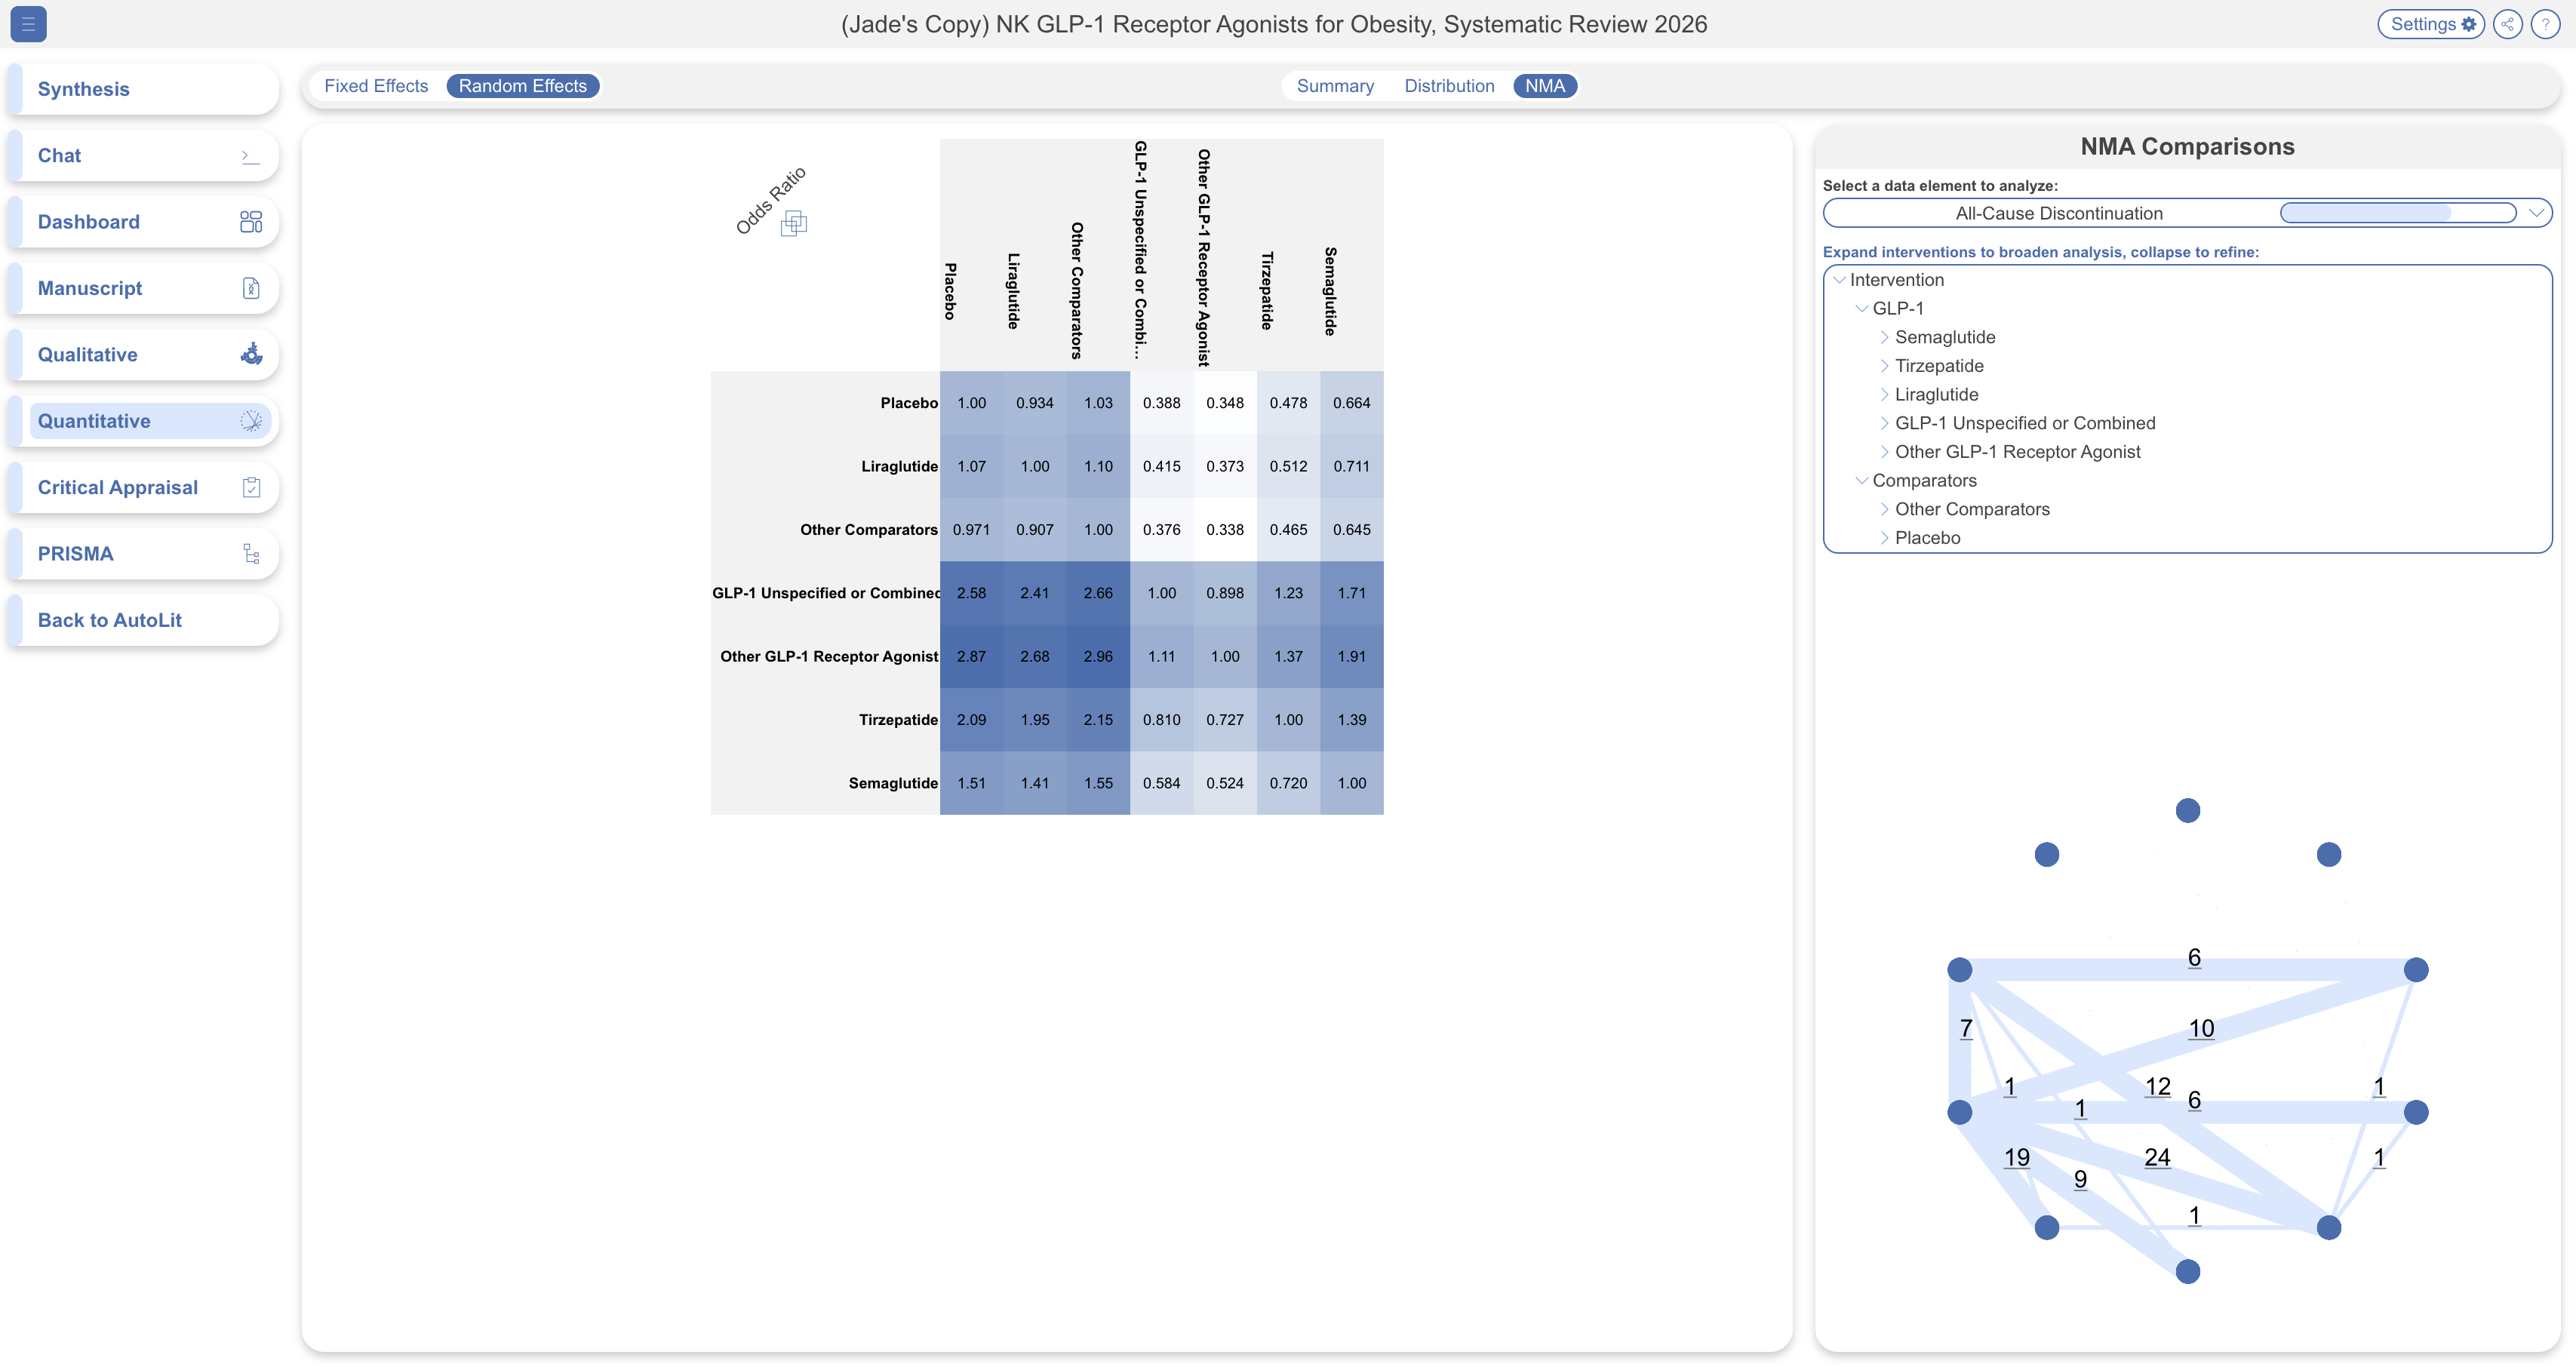
Opening NMA lands you on the League Table — a grid comparing your top-level interventions (the level just below your Root Node) against each other, on whichever data element is most commonly reported by default.

* **Reading the grid:** every intervention is listed on both the rows and the columns. Each cell shows the odds ratio between the intervention in that row and the intervention in that column.
* **Checking heterogeneity:** hover the three-box icon on any cell to see that comparison's I² value. This is an estimate (0–100%) of how much of the variation across studies is due to real differences rather than chance, shown with its own 95% confidence interval. Changing the data element or intervention level recalculates both the odds ratios and every I² value.

#### Choosing Your Data Element And Intervention Level

Use the dropdown in the **NMA Comparisons** panel, upper right, to change which data element the chart compares. Below it, a list of interventions works the same way as Summary's intervention column: select an intervention to expand it and reveal the next level down, drilling deeper one level at a time.

Once you've settled on your intervention levels, a small network diagram appears beneath the list — each node is an intervention (hover to see its name), and each line connecting two nodes represents the number of studies that directly compared them. Use this to identify which interventions have direct head-to-head evidence and which are only connected indirectly, through a shared comparator.

### Comparing Interventions

#### Forest Plots

There are two ways to drill from the grid into the studies behind a comparison:

* **Compare one intervention against everything else:** select its title from either a row or column header. This opens a forest plot showing that intervention's odds ratio and 95% confidence interval against every other intervention in the chart at once.
* **Compare exactly two interventions:** select the individual cell where they intersect instead. This opens a forest plot of every underlying study reporting both interventions, each with its own odds ratio and 95% confidence interval, plus a cumulative odds ratio and 95% confidence interval across all of them — also shown at the top of the page for quick reference.

If forest plots are new to you: each row is one study's comparison, the point marks its odds ratio, and the horizontal line through it shows the confidence interval around that estimate. Since 1 represents equal odds between the two interventions, a comparison whose line crosses 1 isn't statistically distinguishable from "no difference."

Select **Close**, upper left, to exit either view and return to the League Table.

<figure><img src="https://305208404-files.gitbook.io/~/files/v0/b/gitbook-x-prod.appspot.com/o/spaces%2Fxb7uNGATUgwQAjDVQRXG%2Fuploads%2Fpheda36zo51hzj54jxvY%2Fforest%20plots.png?alt=media&amp;token=0ce9367c-60db-4b06-849a-53a7da35000c" alt=""><figcaption></figcaption></figure>

#### SUCRA

Toggle to **SUCRA** to switch from pairwise comparisons to a single ranking of every intervention, ordered by its odds of achieving the outcome you've selected. If a higher rate of the outcome represents patient benefit, the intervention ranked first is the one the evidence currently estimates as most likely to deliver that benefit. Interventions can still be expanded here the same way as in the League Table, for a deeper level of ranking.

<figure><img src="https://305208404-files.gitbook.io/~/files/v0/b/gitbook-x-prod.appspot.com/o/spaces%2Fxb7uNGATUgwQAjDVQRXG%2Fuploads%2FpP5ycY3MvalBw48EOxTv%2Fsucra.png?alt=media&amp;token=c736e982-28ab-44e9-8332-a807ece838ff" alt=""><figcaption></figcaption></figure>

#### Funnel Plot

Toggle to **Funnel Plot** to check a comparison for potential publication bias or small-study effects, rather than to read the effect estimate itself.

* Each study appears as a single point, plotted by its odds ratio (logarithmic scale) against its inverse standard error. Larger, more precise studies tend to sit near the top. Studies that diverge more from the summary estimate sit further from center.
* Hover a point to see the study's title, year, and intervention, select it to open the full study view.
* If more than one intervention is being compared against your selected one, each is shown in a different color.
* A triangle marks the range where 95% of studies are expected to fall if there's no asymmetry.
* An **Egger's test** for asymmetry runs automatically, with its result shown at the top of the plot — a significant result suggests possible publication bias or genuine small-study effects worth investigating further.

<figure><img src="https://305208404-files.gitbook.io/~/files/v0/b/gitbook-x-prod.appspot.com/o/spaces%2Fxb7uNGATUgwQAjDVQRXG%2Fuploads%2F20nVywtw9QlnVzdinMXO%2Ffunnel.png?alt=media&amp;token=42991832-e5c1-4bc2-9865-655f1afbadc8" alt=""><figcaption></figcaption></figure>

#### How Comparisons Are Computed

Indirect effects are computed using the Aitken estimator, with a pairwise-effect weighting correction for multi-arm (3+) studies; intervention rankings use P-scores. For the full statistical detail — including how zero-event studies, funnel plots, and random-effects variance are handled — see [Meta-Analytical Methods](/review-workflow/synthesis/navigate-synthesis-outputs/quantitative-synthesis/meta-analytical-methods.md), the canonical methods reference for everything computed in Quantitative Synthesis.

### FAQs

<details>

<summary>Which studies are included in an NMA comparison?</summary>

The same inclusion logic as the rest of Quantitative Synthesis: studies included at Screening (adjudicated, if dual screening) with Meta-Analytical Extraction marked Complete.

</details>

<details>

<summary>Can I filter which studies appear in a given comparison?</summary>

Yes, through the same Synthesis-wide filters described in [Filters on Synthesis](/review-workflow/synthesis/navigate-synthesis-outputs/filters-on-synthesis.md).

</details>

<details>

<summary>Where can I find the exact statistical methods for a citation?</summary>

See [Meta-Analytical Methods](/review-workflow/synthesis/navigate-synthesis-outputs/quantitative-synthesis/meta-analytical-methods.md) — it documents every computation used here, with sources and open-source verification.

</details>

<details>

<summary>Should I use Random or Fixed Effects here too?</summary>

Yes — the Random/Fixed Effects toggle in the upper left applies across every Quantitative Synthesis view, including NMA. See [Quantitative Synthesis](/review-workflow/synthesis/navigate-synthesis-outputs/quantitative-synthesis.md) for guidance on choosing between them.

</details>

### Next Steps

<table data-card-size="large" data-view="cards"><thead><tr><th></th><th></th><th data-hidden data-card-target data-type="content-ref"></th></tr></thead><tbody><tr><td><i class="fa-chart-line">:chart-line:</i><br><strong>Quantitative Synthesis</strong></td><td>Explore Summary, Distribution, and NMA results.</td><td><a href="/review-workflow/synthesis/navigate-synthesis-outputs/quantitative-synthesis.md">Quantitative Synthesis</a></td></tr><tr><td><i class="fa-chart-scatter">:chart-scatter:</i><br><strong>Meta-Analytical Methods</strong></td><td>Review the statistical methods behind these comparisons.</td><td><a href="/review-workflow/synthesis/navigate-synthesis-outputs/quantitative-synthesis/meta-analytical-methods.md">Meta-Analytical Methods</a></td></tr><tr><td><i class="fa-sliders">:sliders:</i><br><strong>Filters on Synthesis</strong></td><td>Filter the studies shown across Synthesis.</td><td><a href="/review-workflow/synthesis/navigate-synthesis-outputs/filters-on-synthesis.md">Filters on Synthesis</a></td></tr></tbody></table>


---

# Agent Instructions
This documentation is published with GitBook. GitBook is the documentation platform designed so that both humans and AI agents can read, navigate, and reason over technical content effectively. Learn more at gitbook.com.

## Querying This Documentation
If you need additional information that is not directly available in this page, you can query the documentation by asking a question.

Perform an HTTP GET request on the following URL with the `ask` and `goal` query parameters:

```
GET https://docs.nested-knowledge.com/review-workflow/synthesis/navigate-synthesis-outputs/quantitative-synthesis/explore-nma.md?ask=<question>&goal=<user_goal>
```

`ask` is the immediate question: it should be specific, self-contained, and written in natural language.
`goal` is what the user is ultimately trying to achieve, the reason they need the answer. Sharing it helps GitBook give you a better, more relevant answer. A goal is most helpful when it describes the outcome the user wants rather than restating the question. For example, with `ask=how do I create an API token`, a goal like `automate deployments from our CI pipeline` lets GitBook tailor the answer to that use case.

The response will contain a direct answer to the question and relevant excerpts and sources from the documentation.

Use this mechanism when the answer is not explicitly present in the current page, you need clarification or additional context, or you want to retrieve related documentation sections.
